(GIS) Map Data Visualization, R-tree Algorithm
GIS Data Visualization
When working with GIS data and rendering visualizations, you often need to classify which region a given latitude/longitude belongs to. For example:
1
2
Region1: (127.123, 36.231), (127.154, 36.271), (127.203, 36.181)
Region2: (127.423, 36.531), (127.454, 36.571), (127.503, 36.581)
There are algorithms like d3.geoContains that determine whether a (longitude, latitude) point falls within a given region.
What algorithm does d3.geoContains use internally? Let’s just look at the name for a hint.
Ray-Casting: To determine whether a point is inside a polygon, the Ray-Casting algorithm is typically used. From the given point, you draw a ray in an arbitrary direction and count how many times it crosses the polygon’s boundary — if the count is odd, the point is inside; if even, it’s outside.
Handling continent-scale boundaries: Given the Earth’s curvature and the large areas involved, coordinate transformations are performed to account for differences in coordinate systems and the irregularity of the Earth’s surface. This also prevents issues where boundaries wrap around incorrectly when longitude exceeds 180 degrees.
So it seems like geometric algorithms such as Ray-Casting are used, adapted for the characteristics of GIS data.
Anyway, geoContains(object, point) takes a region and a point and returns true/false depending on whether the point hits that region.
For example, if there are 300 regions and 10,000 location data points, for each single data point you’d iterate through all 300 regions until you find a hit.
That comes out to 300 * 10,000 = 3 million operations. That’s way too many to run on every render.
We need to reduce that O(n^2) time complexity. What if we first narrow down the regions near the point, and only then check geoContains within that narrowed set?
##
R-tree
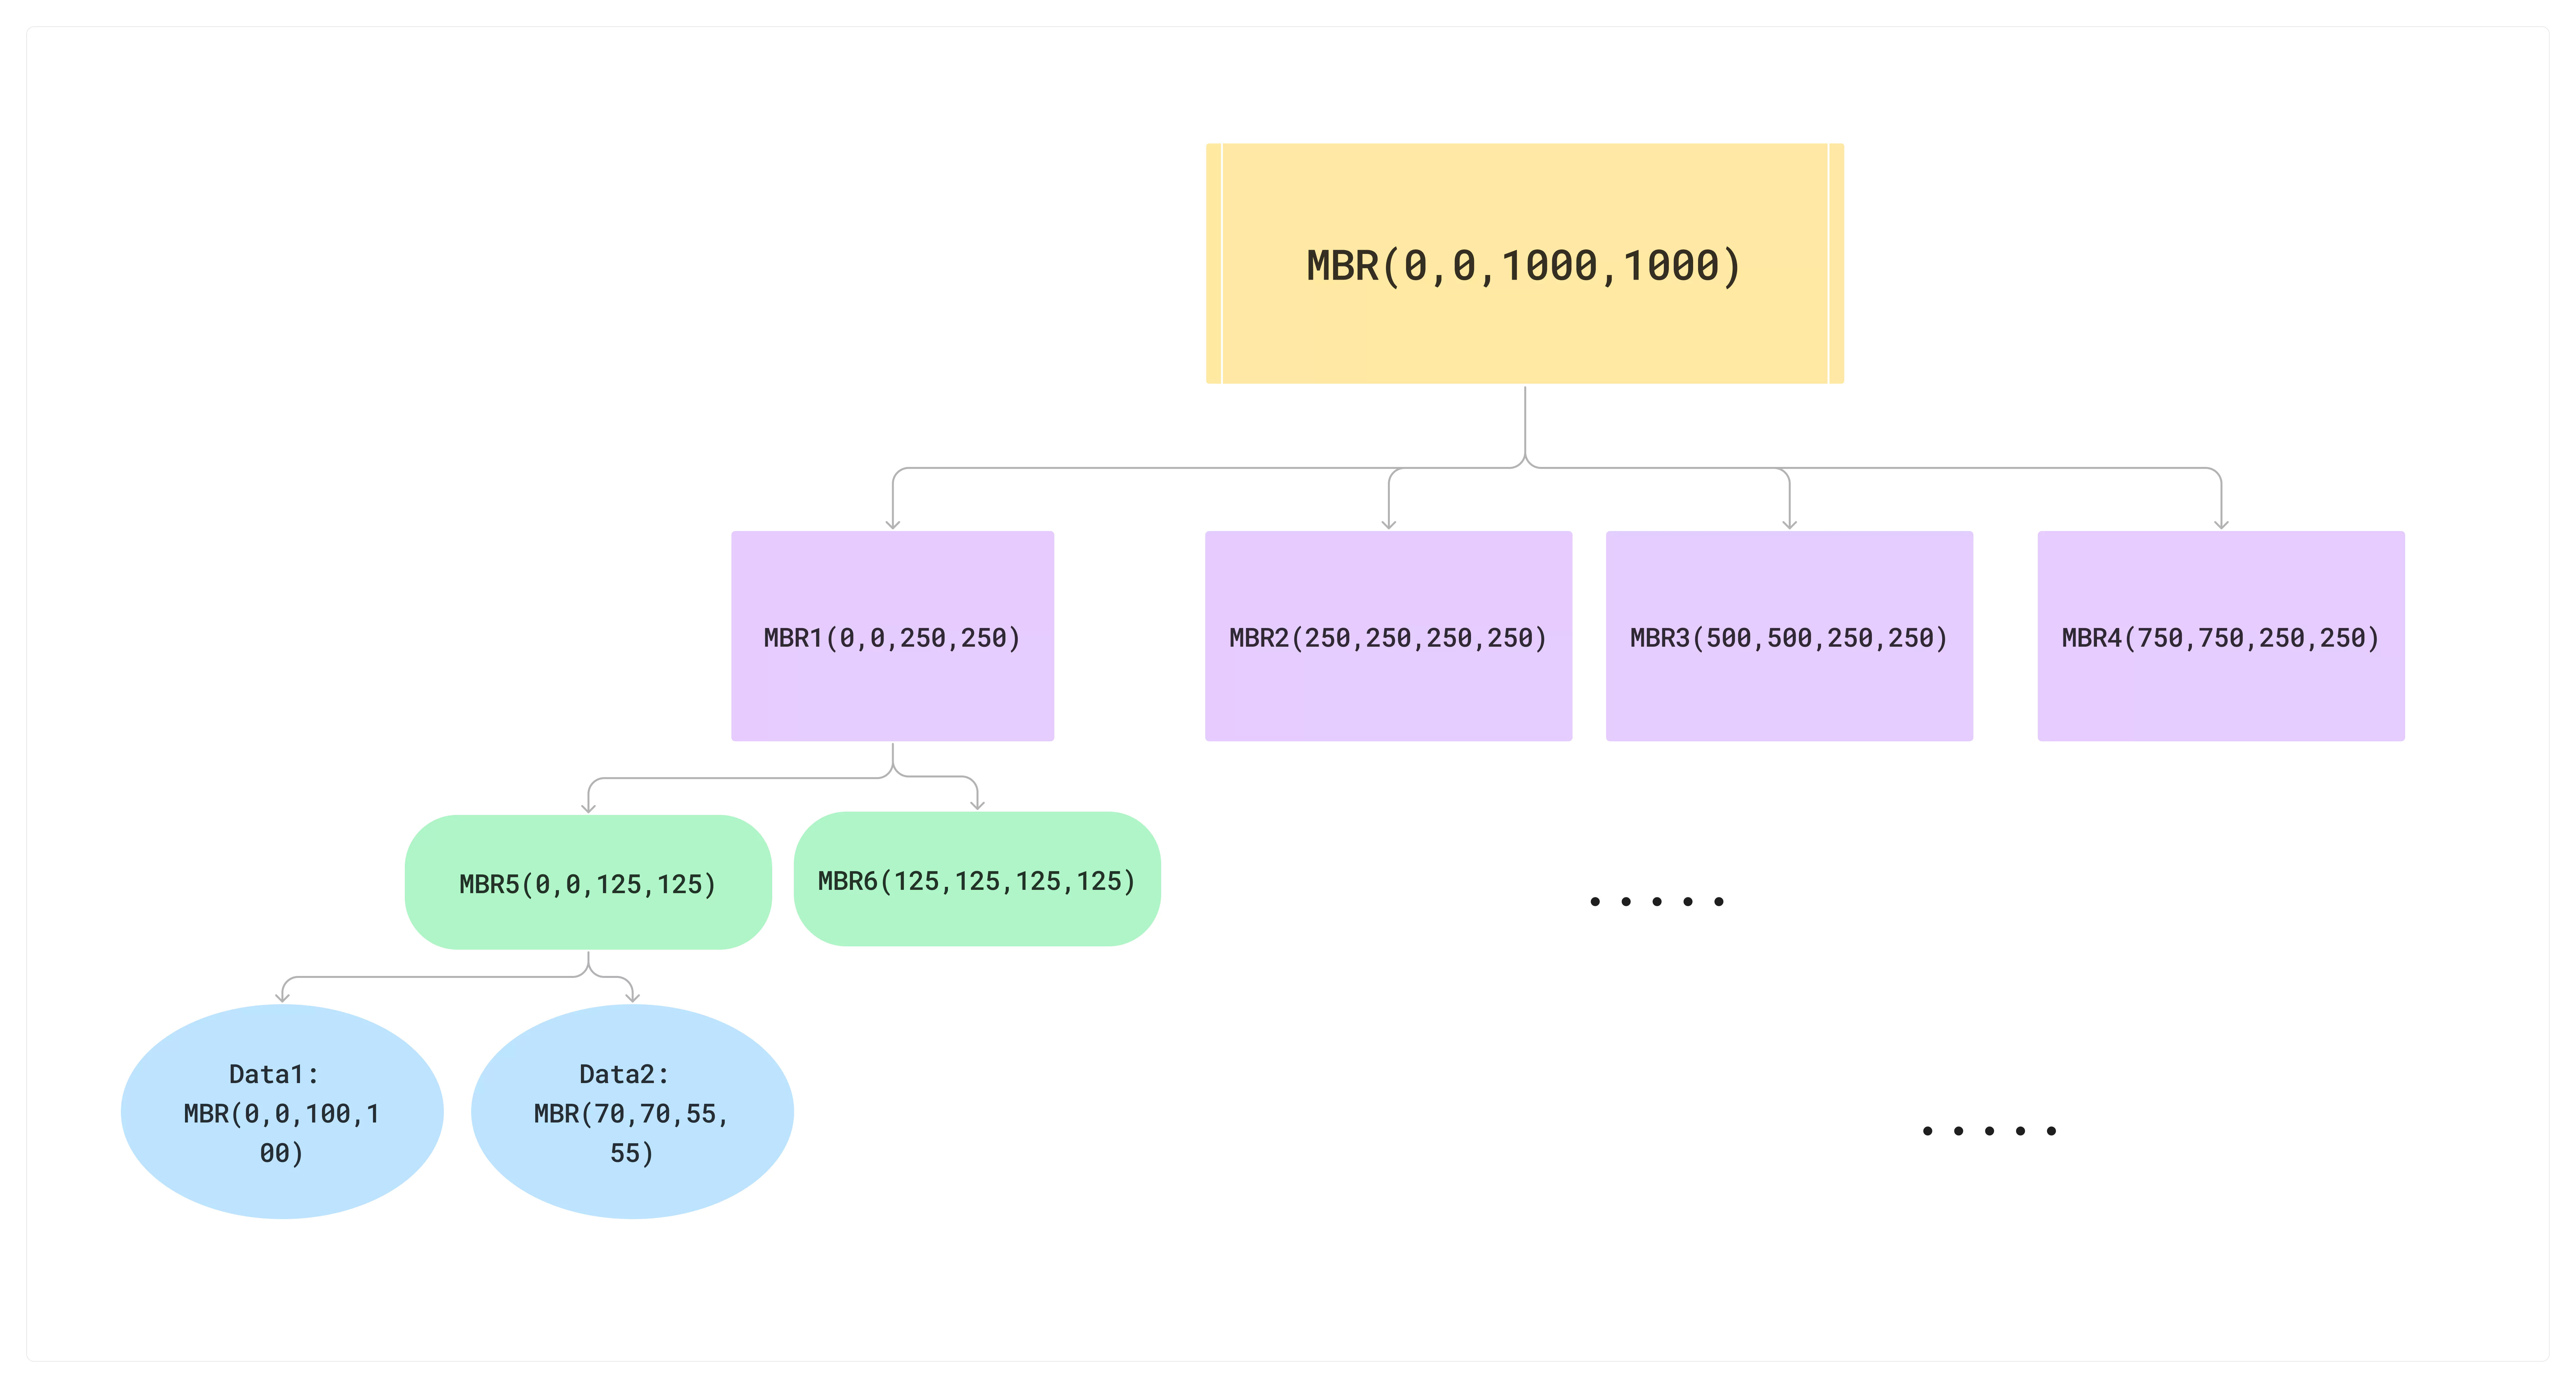 R-tree
MBR: Minimum Bounding Rectangle
Internal Node: a node containing pointers toward leaf nodes; its MBR represents the combined range of its child nodes
Leaf Node: a node that contains the actual data
In the diagram above, the last layer (blue) is the Leaf Node layer, and everything above it is Internal Nodes.
Search
Searches can be either range queries or proximity queries.
Range Query: given a specific area (rectangle, circle, etc.), find all data items that overlap with that area.
Nearest Neighbor Query: given a specific coordinate, find the closest data item(s).
Search Process (Nearest Neighbor Query)
- Start at the root node:
- Compute the minimum distance between the reference point and every child node (MBR) of the root.
- Sort the nodes by distance and start the search from the closest one.
- Traverse internal nodes:
- Among an internal node’s children, explore based on the minimum-distance candidates.
- Nodes that are far from the reference point are excluded from the search.
- Traverse leaf nodes:
- Once a leaf node is reached, compute the distance between each data item and the reference point.
- Update the closest item(s) found so far.
- Pruning:
- As the search proceeds, once a closer item is found, nodes that are farther away are excluded.
- This progressively shrinks the search space, improving efficiency.
Split
- When a node becomes full, it is split into two new nodes. During the split, data is distributed so as to minimize overlap.
- Each resulting node then recalculates its MBR to keep the tree balanced.
##
R-tree vs. Nested-loop Timing Comparison
The overlap condition is: overlap = not (non-overlap condition).
1
2
3
4
!(box.minX > searchArea.maxX ||
    box.maxX < searchArea.minX ||
    box.minY > searchArea.maxY ||
    box.maxY < searchArea.minY)
If any one of these is true, the boxes don’t overlap.
Let’s assume 1 million location data points and 1,000 region data entries, and measure R-tree timing (using the npm rbush library).
Nested Loop
1
2
3
4
5
6
7
8
9
10
11
12
13
14
15
16
17
18
19
20
21
22
23
24
25
26
27
28
29
30
31
32
33
34
35
36
37
38
39
40
41
42
43
44
45
46
47
48
49
50
51
52
53
54
55
56
// Function to generate random region data
const generateRandomData = (count) => {
    const data = [];
    for (let i = 0; i < count; i++) {
        const x = Math.random() * 1000;
        const y = Math.random() * 1000;
        const width = Math.random() * 10;
        const height = Math.random() * 10;
        data.push({
            minX: x,
            minY: y,
            maxX: x + width,
            maxY: y + height,
        });
    }
    return data;
};

// Search function (nested loop)
const searchBoxes = (data, searchArea) => {
    const results = [];
    for (const box of data) {
        // Check overlap condition
        if (
            !(box.minX > searchArea.maxX ||
                box.maxX < searchArea.minX ||
                box.minY > searchArea.maxY ||
                box.maxY < searchArea.minY)
        ) {
            results.push(box);
        }
    }
    return results;
};

console.time("Total Time");
// Generate region data
const dataCount = 1_000;
const data = generateRandomData(dataCount);

// Perform search and measure time
const searchCount = 1_000_000;
console.time('Search Time');
for (let i = 0; i < searchCount; i++) {
    const x = Math.random() * 1000;
    const y = Math.random() * 1000;
    const searchArea = {
        minX: x,
        minY: y,
        maxX: x + 50,
        maxY: y + 50,
    };
    const results = searchBoxes(data, searchArea);
}
console.timeEnd('Search Time');
console.timeEnd("Total Time");
1
Search Time: 3.302s
R-tree
1
2
3
4
5
6
7
8
9
10
11
12
13
14
15
16
17
18
19
20
21
22
23
24
25
26
27
28
29
30
31
32
33
34
35
36
37
38
39
40
41
42
43
44
45
46
47
48
const RBush = require('rbush');

const tree = new RBush();

// Function to generate random region data
const generateRandomData = (count) => {
    const data = [];
    for (let i = 0; i < count; i++) {
        const x = Math.random() * 1000;
        const y = Math.random() * 1000;
        const width = Math.random() * 10;
        const height = Math.random() * 10;
        data.push({
            minX: x,
            minY: y,
            maxX: x + width,
            maxY: y + height,
        });
    }
    return data;
};

console.time("Total Time");
// Generate region data
const dataCount = 1_000;
const data = generateRandomData(dataCount);
// Insert data into R-tree and measure time
console.time('Insertion Time');
tree.load(data);
console.timeEnd('Insertion Time');

// Perform search and measure time
const searchCount = 1_000_000;
console.time('Search Time');
for (let i = 0; i < searchCount; i++) {
    const x = Math.random() * 1000;
    const y = Math.random() * 1000;
    const searchArea = {
        minX: x,
        minY: y,
        maxX: x + 50,
        maxY: y + 50,
    };
    const a = tree.search(searchArea);
    // console.log(a.length);
}
console.timeEnd('Search Time');
console.timeEnd("Total Time");
1
2
3
Insertion Time: 2.125ms
Search Time: 293.518ms
Total Time: 301.968ms
##
Conclusion
Even outside of GIS, working on data visualization tends to lead you into fairly complex state and data logic.
When designing an algorithm, watch out for O(n^2) complexity, and take the characteristics of your data into account to bring it down to O(N) or O(log N).
Related Posts
2024.10.01 - [JS,Node,React] - Map visualization with React and D3.js
2024.11.06 - [JS,Node,React] - mapshaper - Working with South Korea administrative dong map data