Map Visualization with React and D3.js
Approaches to Map Visualization
What if you use a map API like Naver, Kakao, or Mapbox?
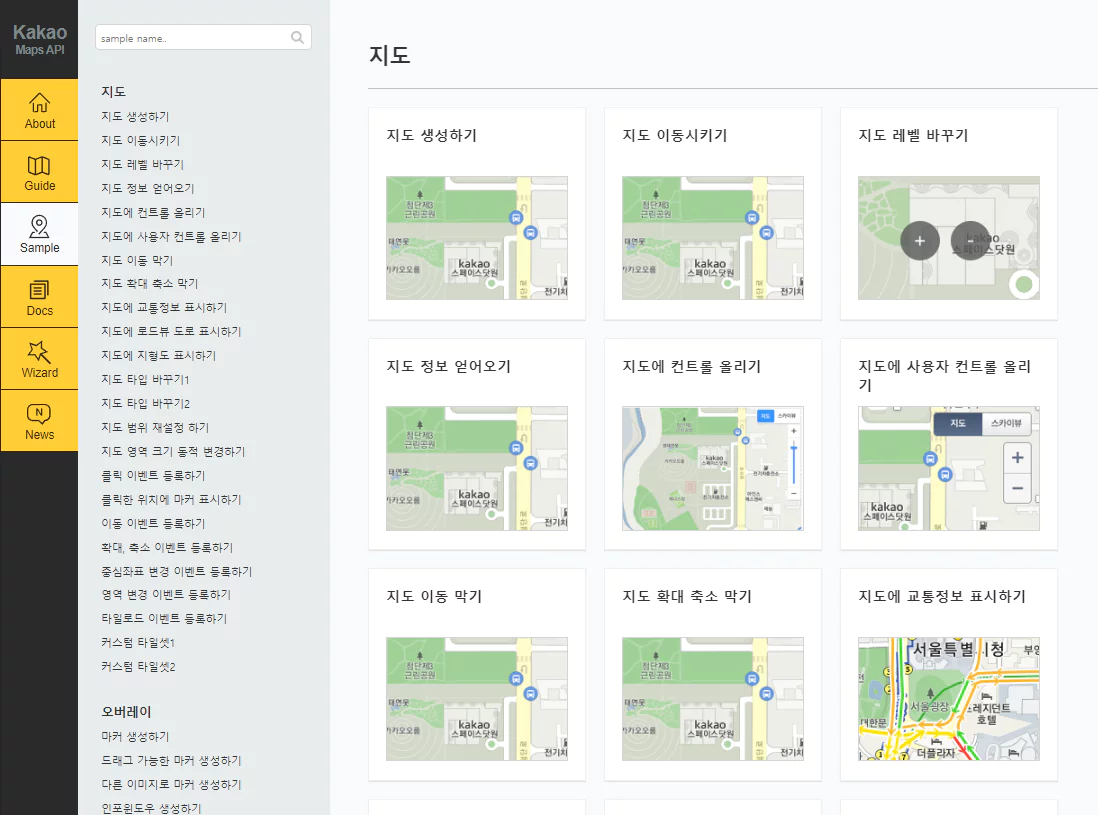 Kakao Map API
- Pros - No need to draw the map yourself, and you can implement visualization features with very little code.
- Cons - Hard to customize the default design, and the visualization feature you want might not be available. You may also be charged based on usage.
What if you draw the map yourself on a canvas, like SVG or <canvas>?
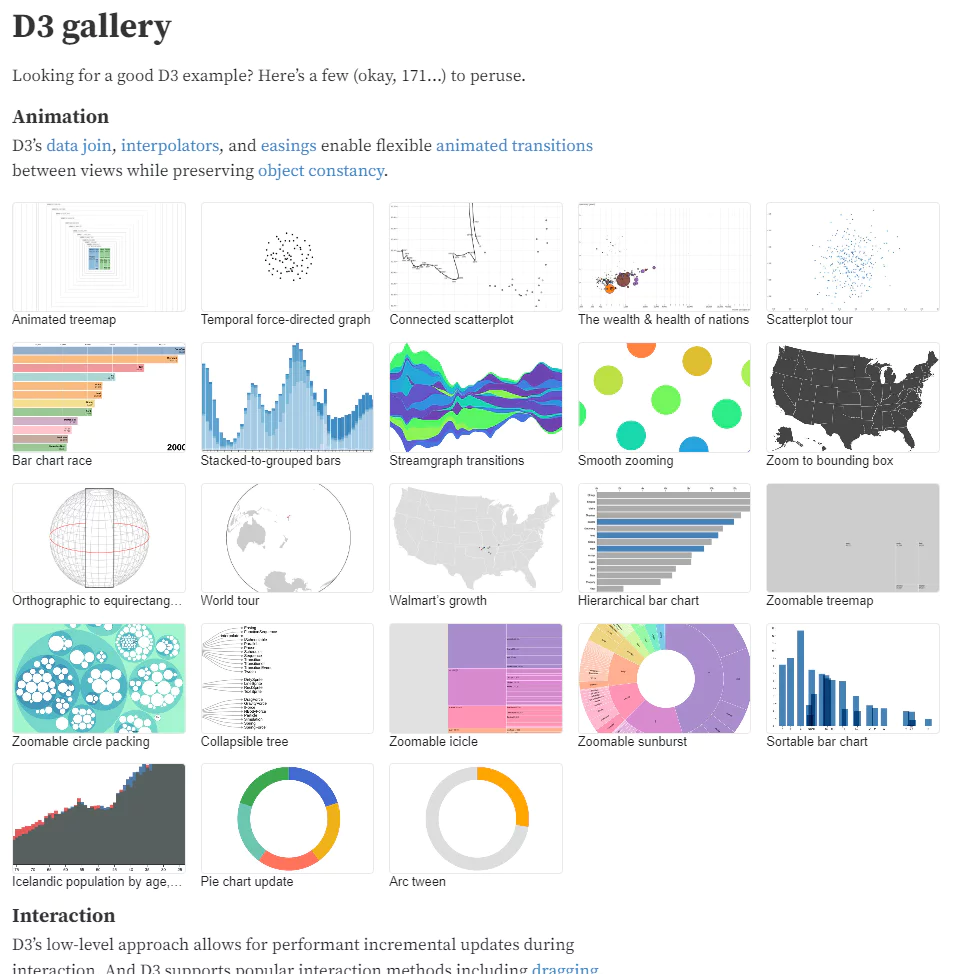 d3 example
- Pros - You have full control over every element being drawn, and using a visualization library like d3 lets you build dynamic graphics.
- Cons - More code and more state to manage.
Preparing Map Data
If you’ve decided to draw the map yourself, let’s take a look at map data formats.
GeoJSON, TopoJSON
| Characteristic | GeoJSON | TopoJSON |
| Data structure | Simple geographic structures (points, lines, polygons) | Topology-based structure (nodes, links, arcs) |
| Shared boundary handling | Boundaries are stored redundantly | Boundaries are stored once and reused across multiple regions |
| File size | Larger | Compressed and smaller |
| Relationships between geographic objects | Each geographic object is independent | Boundaries are shared, and relationships between objects are defined |
| Data conversion | Generally more intuitive and easier to use | Requires a conversion tool (e.g. GeoJSON ↔ TopoJSON) |
| Support | Directly supported by most map libraries | Directly supported only by some libraries, such as D3.js |
https://github.com/vuski/admdongkor
A repo that provides GeoJSON data for South Korea.
https://github.com/raqoon886/Local_HangJeongDong?tab=readme-ov-file
There’s also a repo that splits the South Korea GeoJSON data into administrative dong (neighborhood) units by the 17 metropolitan cities/provinces. (Not recently updated.)
The site above lets you convert the GeoJSON you just downloaded from GitHub into TopoJSON.
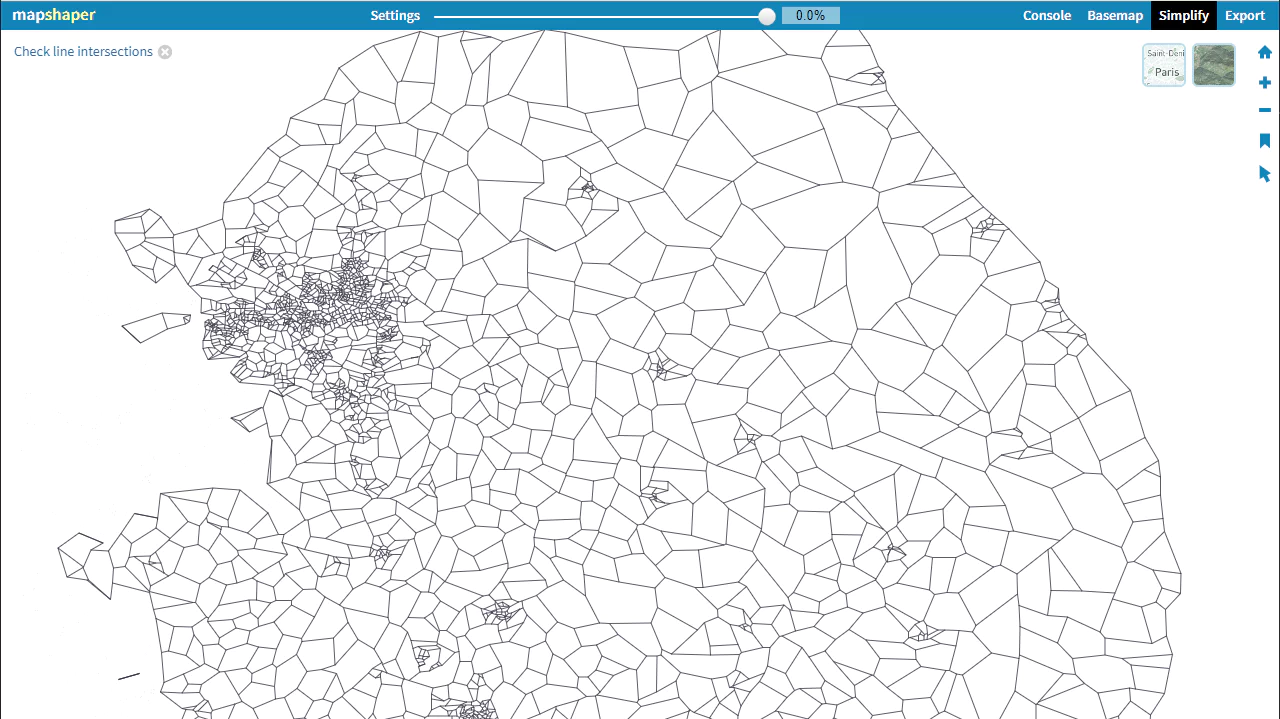 mapshaper.org
You can upload your GeoJSON to the site, reduce data size by simplifying boundaries in the Simplify menu, and then download it as TopoJSON from the Export menu.
Drawing the Map (React, D3)
https://observablehq.com/@d3/zoom-to-bounding-box
Let’s draw the map based on the example above.
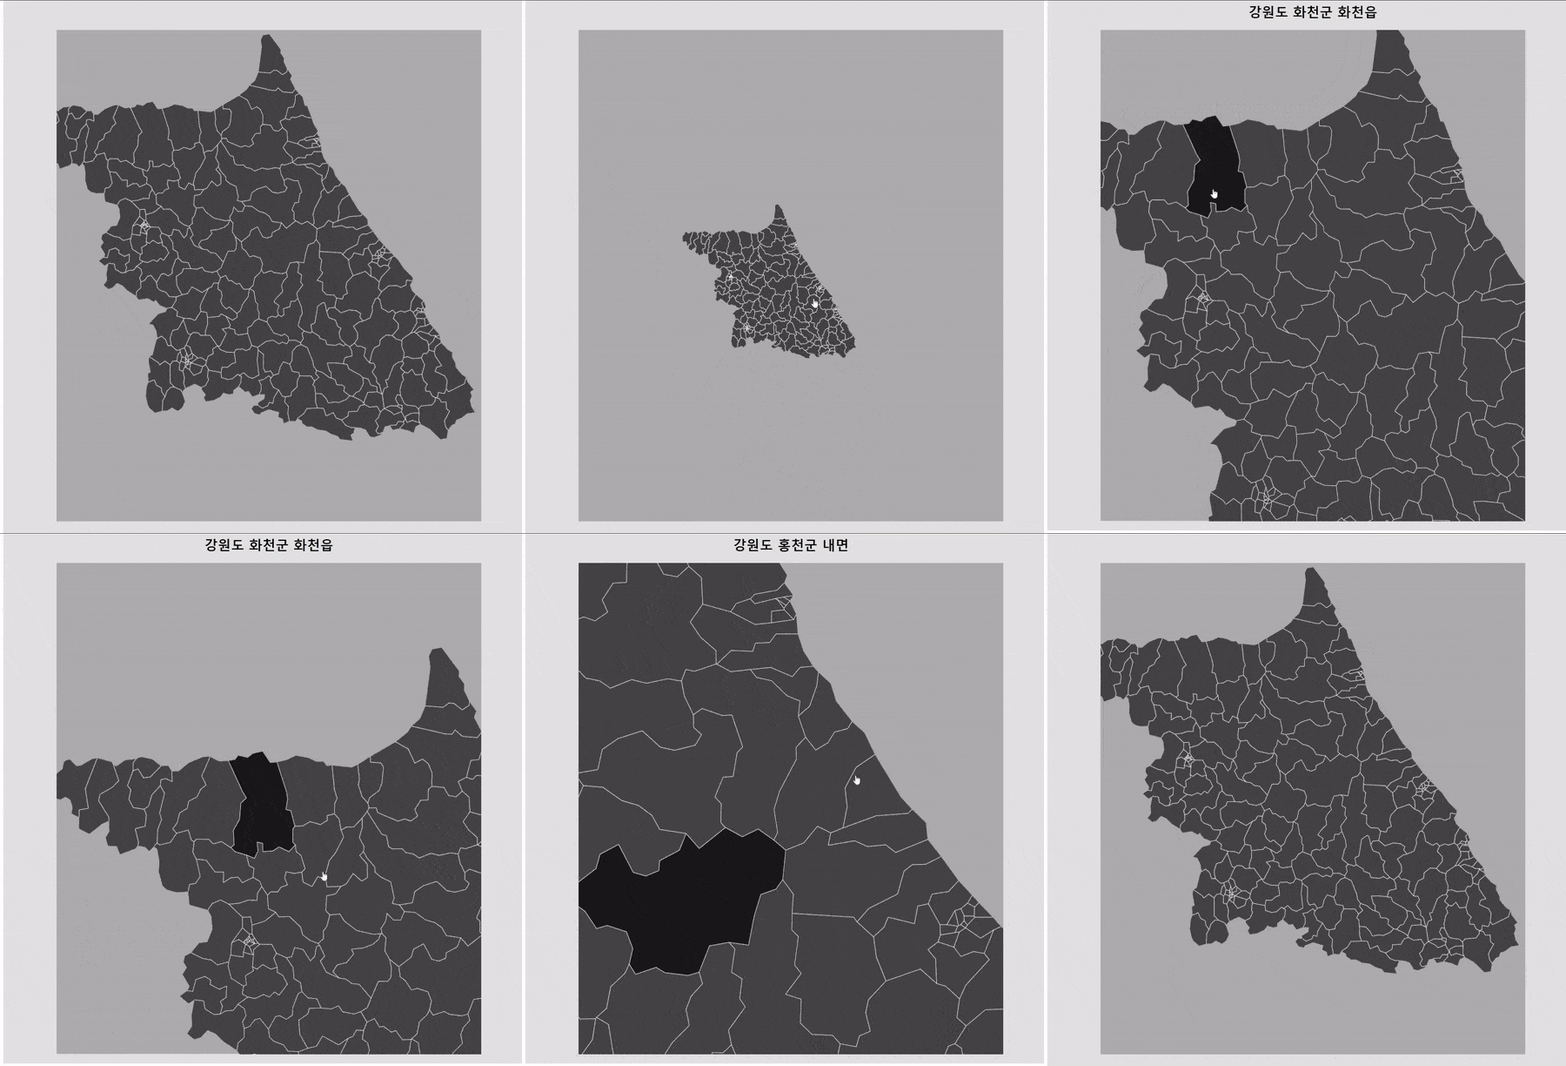
The example uses TopoJSON. I converted the Gangwon-do GeoJSON to TopoJSON and used that.
Note that D3.js manipulates the DOM directly, while React manipulates a virtual DOM.
So in React, we write the code so that D3 manipulates the DOM only after the component has mounted.
▼ Code
1
2
3
4
5
6
7
8
9
10
11
12
13
14
15
16
17
18
19
20
21
22
23
24
25
26
27
28
29
30
31
32
33
34
35
36
37
38
39
40
41
42
43
44
45
46
47
48
49
50
51
52
53
54
55
56
57
58
59
60
61
62
63
64
65
66
67
68
69
70
71
72
73
74
75
76
77
78
79
80
81
82
83
84
85
86
87
88
89
90
91
92
93
94
95
96
97
98
99
100
101
102
103
104
105
106
107
108
109
110
111
112
113
114
115
116
117
118
119
120
121
122
123
124
import React, { useEffect, useRef, useState } from 'react';
import topoData from './강원도_topojson.json';
import * as topojson from 'topojson-client';
import * as d3 from 'd3';

export const MapVisualize = () => {
    const svgRef = useRef(null);
    const [name, setName] = useState('');

    useEffect(() => {
        if (svgRef.current) {
            const geoData = topojson.feature(topoData, topoData.objects.hangjeongdong_강원도).features;

            const zoom = d3.zoom().scaleExtent([0.3, 10]).on('zoom', zoomed);
            const width = svgRef.current.clientWidth;
            const height = svgRef.current.clientHeight;

            // Prepare the canvas
            const svg = d3
                .select(svgRef.current)
                .attr('viewBox', [0, 0, width, height])
                .attr('width', width)
                .attr('height', height)
                .attr('style', 'max-width: 100%; height: auto;')
                .on('click', reset);

            // Set up the projection
            const projection = d3
                .geoMercator()
                .center([128.35, 37.68]) // Set the center to the target coordinates
                .scale(28000) // Set the initial scale
                .translate([width / 2, height / 2]); // Move to the center of the SVG

            const path = d3.geoPath().projection(projection);

            const g = svg.append('g');

            // Draw the land
            const states = g
                .append('g')
                .attr('fill', '#444')
                .attr('cursor', 'pointer')
                .selectAll('path')
                .data(geoData)
                .join('path')
                .on('click', clicked)
                .attr('d', path);

            svg.call(zoom);
            states.append('title').text((d) => d.properties.adm_nm);

            // Draw the boundaries
            g.append('path')
                .attr('fill', 'none')
                .attr('stroke', 'white')
                .attr('stroke-linejoin', 'round')
                .attr('d', path(topojson.mesh(topoData, topoData.objects.hangjeongdong_강원도, (a, b) => a !== b)));

            function reset() {
                states.transition().style('fill', null);
                setName("");
                svg.transition()
                    .duration(750)
                    .call(zoom.transform, d3.zoomIdentity, d3.zoomTransform(svg.node()).invert([width / 2, height / 2]));
            }

            function clicked(event, d) {
                console.log(d.properties.adm_nm);
                setName(d.properties.adm_nm);
                const [[x0, y0], [x1, y1]] = path.bounds(d);
                event.stopPropagation();
                states.transition().style('fill', null);
                d3.select(this).transition().style('fill', '#181818');
                svg.transition()
                    .duration(750)
                    .call(
                        zoom.transform,
                        d3.zoomIdentity
                            .translate(width / 2, height / 2)
                            .scale(Math.min(8, 0.5 / Math.max((x1 - x0) / width, (y1 - y0) / height))) // AAA
                            .translate(-(x0 + x1) / 2, -(y0 + y1) / 2),
                        d3.pointer(event, svg.node())
                    );
            }

            function zoomed(event) {
                const { transform } = event;
                g.attr('transform', transform);
                g.attr('stroke-width', 1 / transform.k);
            }
        }
    }, []);
    return (
        <div
            style={{
                width: '100vw',
                height: '100vh',
                backgroundColor: '#e2e2e2',
                display: 'flex',
                justifyContent: 'center',
                alignItems: 'center',
                flexDirection: "column"
            }}
        >
            <h1>{name}</h1>
            <div
                style={{
                    width: '80%',
                    height: '90%',
                    backgroundColor: '#acacac',
                }}
            >
                <svg
                    ref={svgRef}
                    style={{
                        width: '100%',
                        height: '100%',
                        border: '1px solid white',
                    }}
                ></svg>
            </div>
        </div>
    );
};
Regarding the formula next to the AAA comment inside clicked():
The 0.5 means that for a state larger than the SVG size, we scale it down to fit, and for a smaller state, we scale it up.
The 8 in front is the upper bound placed on the scale when zooming out to fit a large state.