React, D3.js를 이용한 지도 시각화
지도 시각화 방법
네이버, 카카오, Mapbox 등 지도 데이터를 제공하는 api를 활용한다면?
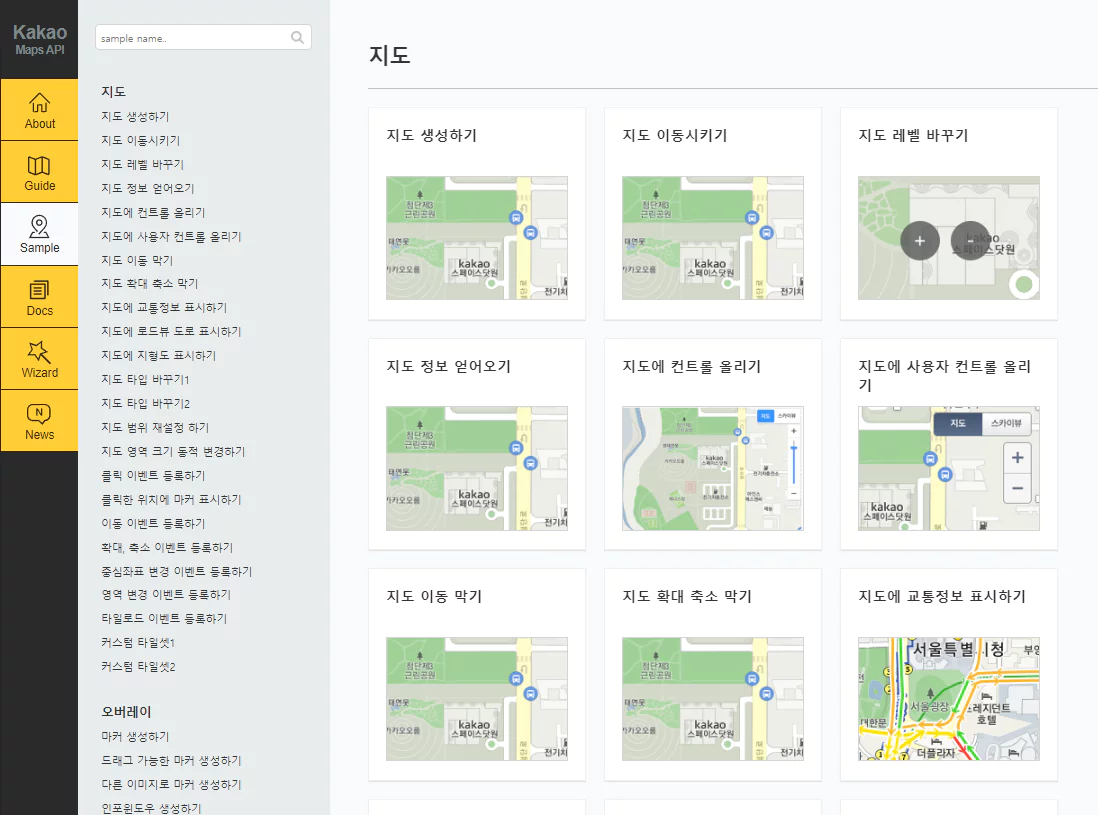 카카오 맵 api
- 장점 - 지도를 그릴 필요 없고, 적은 코드로 시각화 기능을 구현할 수 있다.
- 단점 - 기본 디자인을 바꾸기 어렵고, 원하는 시각화 기능이 없을 수 있다. 사용량에 따라 요금이 부과될 수 있다.
svg나 canvas 같은 도화지에 지도부터 그린다면?
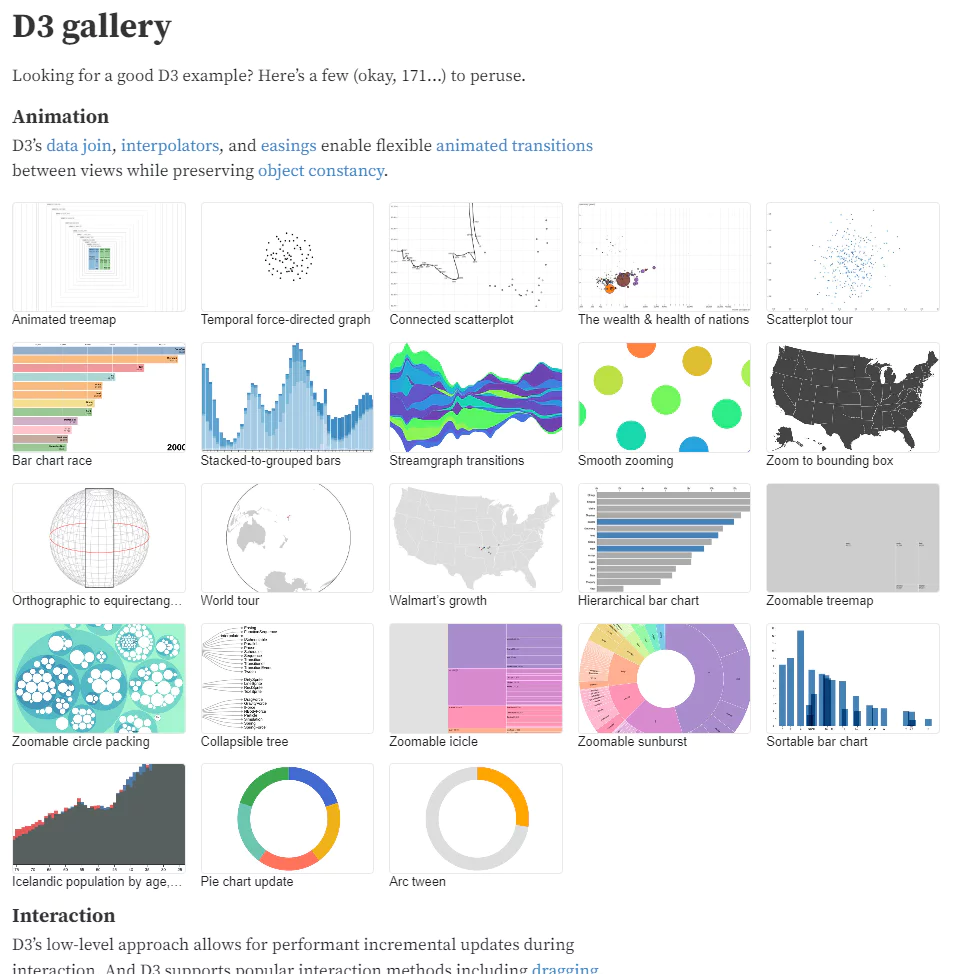 d3 example
- 장점 - 그려지는 모든 요소를 컨트롤할 수 있고, d3 같은 시각화 라이브러리를 사용하면 동적인 그래픽을 만들 수 있다.
- 단점 - 더 많은 코드와 더 많은 상태 관리가 생긴다.
지도 데이터 준비
아무튼 지도를 직접 그리기로 했다면 지도 데이터에 대해 알아보자.
GeoJSON, TopoJSON
| 특징 | GeoJSON | TopoJSON |
| 데이터 구조 | 단순한 지리적 구조 (점, 선, 다각형) | 토폴로지 기반의 구조 (노드, 링크, 아크) |
| 중복 경계 처리 | 경계를 중복해서 저장 | 경계를 한 번만 저장하고, 여러 지역에서 재사용 가능 |
| 파일 크기 | 더 큼 | 압축되어 더 작음 |
| 지리 객체 간 관계 | 각 지리 객체가 독립적 | 경계를 공유하고, 객체 간의 관계가 정의됨 |
| 데이터 변환 | 일반적으로 더 직관적이고 사용이 쉬움 | 변환 도구를 사용해야 함 (예: GeoJSON ↔ TopoJSON) |
| 지원 범위 | 대부분의 지도 라이브러리에서 직접 지원 | D3.js 등 일부 라이브러리에서 직접 지원됨 |
https://github.com/vuski/admdongkor
대한민국 geoJson 데이터를 제공하는 레포이다.
https://github.com/raqoon886/Local_HangJeongDong?tab=readme-ov-file
대한민국 geoJson 데이터에서 17개 광역시/도별 행정동으로 geoJson을 분리해 놓은 레포도 있다. (최근 업데이트는 아니다.)
위 사이트는 아까 깃헙에서 다운받은 GeoJSON을 TopoJSON으로 변환할 수 있다.
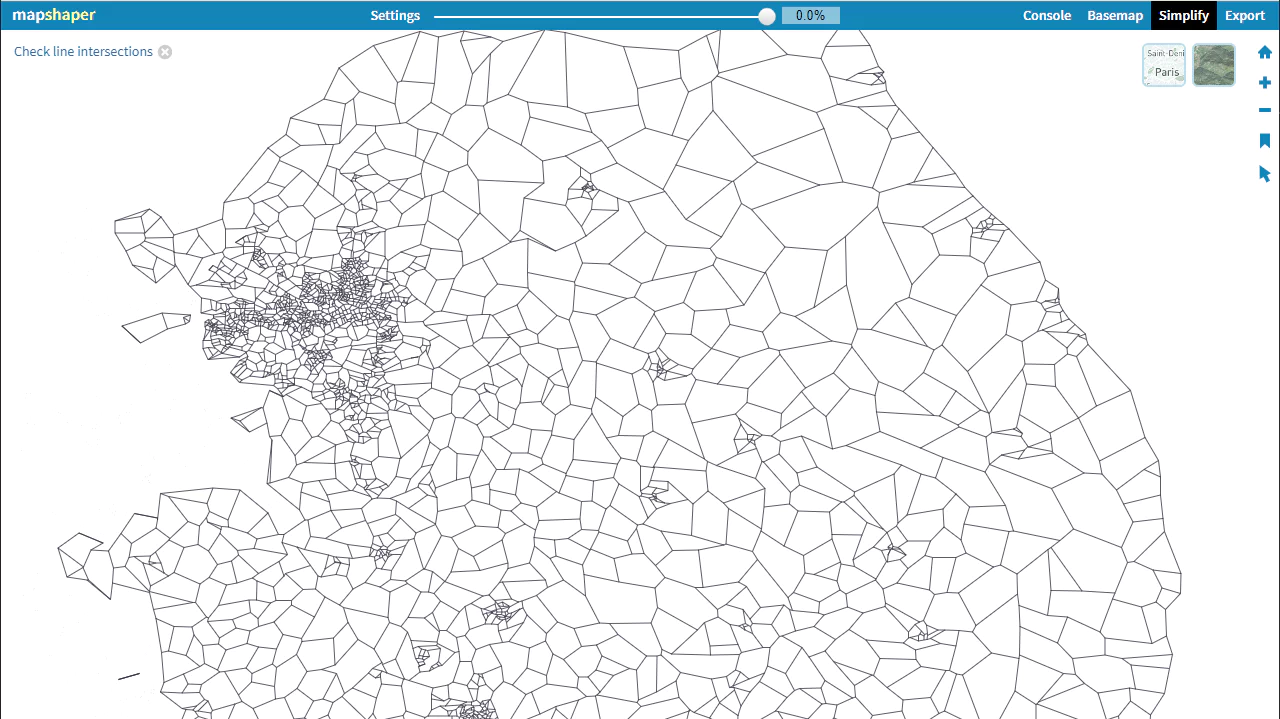 mapshaper.org
사이트에 geoJson을 업로드하고, Simplify 메뉴에서 경계를 단순화하며 데이터를 줄일 수 있고, Export 메뉴에서 TopoJson으로 다운로드할 수 있다.
지도 그리기 (React, D3)
https://observablehq.com/@d3/zoom-to-bounding-box
위 예제를 바탕으로 지도를 그려보자.
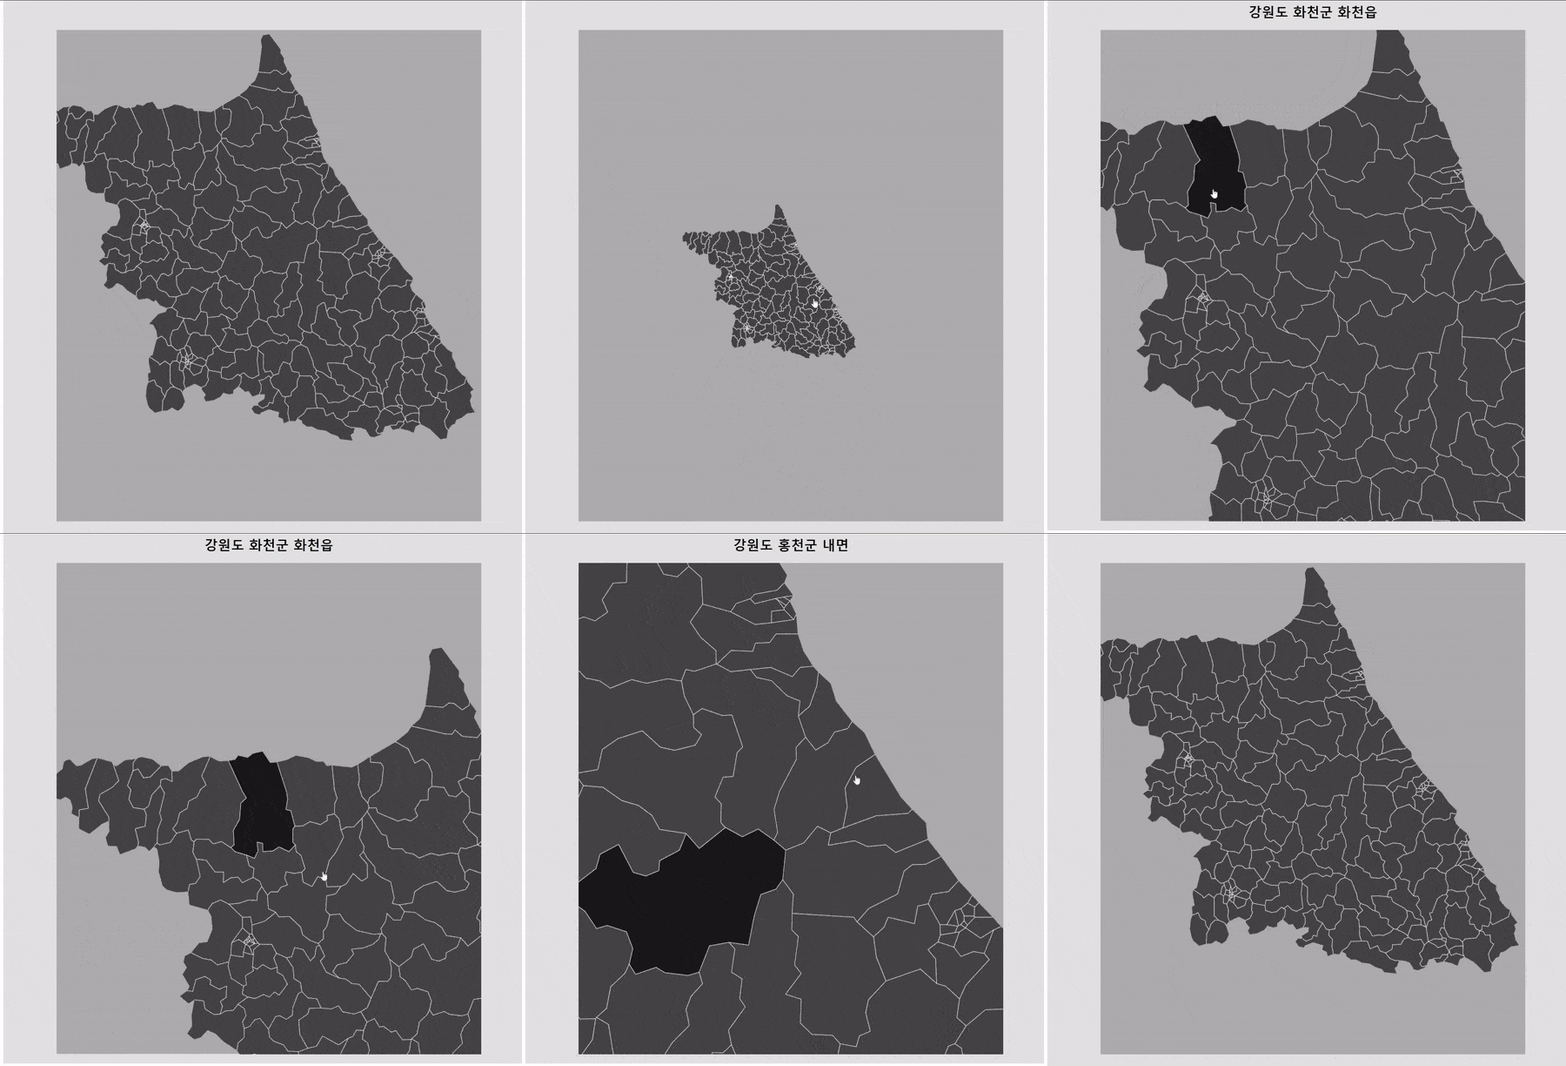
예제에서는 TopoJSON을 사용하고 있다. 강원도 GeoJSON -> TopoJSON 으로 변환하여 사용하였다.
참고로 D3.js는 DOM을 직접 조작하고 React는 가상 DOM을 조작한다.
그래서 react에서 컴포넌트가 마운트 된 후 d3로 DOM을 조작하도록 코드를 작성한다.
▼코드
1
2
3
4
5
6
7
8
9
10
11
12
13
14
15
16
17
18
19
20
21
22
23
24
25
26
27
28
29
30
31
32
33
34
35
36
37
38
39
40
41
42
43
44
45
46
47
48
49
50
51
52
53
54
55
56
57
58
59
60
61
62
63
64
65
66
67
68
69
70
71
72
73
74
75
76
77
78
79
80
81
82
83
84
85
86
87
88
89
90
91
92
93
94
95
96
97
98
99
100
101
102
103
104
105
106
107
108
109
110
111
112
113
114
115
116
117
118
119
120
121
122
123
124
import React, { useEffect, useRef, useState } from 'react';
import topoData from './강원도_topojson.json';
import * as topojson from 'topojson-client';
import * as d3 from 'd3';

export const MapVisualize = () => {
    const svgRef = useRef(null);
    const [name, setName] = useState('');

    useEffect(() => {
        if (svgRef.current) {
            const geoData = topojson.feature(topoData, topoData.objects.hangjeongdong_강원도).features;

            const zoom = d3.zoom().scaleExtent([0.3, 10]).on('zoom', zoomed);
            const width = svgRef.current.clientWidth;
            const height = svgRef.current.clientHeight;

            // 도화지 준비
            const svg = d3
                .select(svgRef.current)
                .attr('viewBox', [0, 0, width, height])
                .attr('width', width)
                .attr('height', height)
                .attr('style', 'max-width: 100%; height: auto;')
                .on('click', reset);

            // 투영법 설정
            const projection = d3
                .geoMercator()
                .center([128.35, 37.68]) // 목표 좌표로 중심 설정
                .scale(28000) // 초기 스케일 설정
                .translate([width / 2, height / 2]); // SVG의 중앙으로 이동

            const path = d3.geoPath().projection(projection);

            const g = svg.append('g');

            // 땅 그리기
            const states = g
                .append('g')
                .attr('fill', '#444')
                .attr('cursor', 'pointer')
                .selectAll('path')
                .data(geoData)
                .join('path')
                .on('click', clicked)
                .attr('d', path);

            svg.call(zoom);
            states.append('title').text((d) => d.properties.adm_nm);

            // 경계선 그리기
            g.append('path')
                .attr('fill', 'none')
                .attr('stroke', 'white')
                .attr('stroke-linejoin', 'round')
                .attr('d', path(topojson.mesh(topoData, topoData.objects.hangjeongdong_강원도, (a, b) => a !== b)));

            function reset() {
                states.transition().style('fill', null);
                setName("");
                svg.transition()
                    .duration(750)
                    .call(zoom.transform, d3.zoomIdentity, d3.zoomTransform(svg.node()).invert([width / 2, height / 2]));
            }

            function clicked(event, d) {
                console.log(d.properties.adm_nm);
                setName(d.properties.adm_nm);
                const [[x0, y0], [x1, y1]] = path.bounds(d);
                event.stopPropagation();
                states.transition().style('fill', null);
                d3.select(this).transition().style('fill', '#181818');
                svg.transition()
                    .duration(750)
                    .call(
                        zoom.transform,
                        d3.zoomIdentity
                            .translate(width / 2, height / 2)
                            .scale(Math.min(8, 0.5 / Math.max((x1 - x0) / width, (y1 - y0) / height))) // AAA
                            .translate(-(x0 + x1) / 2, -(y0 + y1) / 2),
                        d3.pointer(event, svg.node())
                    );
            }

            function zoomed(event) {
                const { transform } = event;
                g.attr('transform', transform);
                g.attr('stroke-width', 1 / transform.k);
            }
        }
    }, []);
    return (
        <div
            style={{
                width: '100vw',
                height: '100vh',
                backgroundColor: '#e2e2e2',
                display: 'flex',
                justifyContent: 'center',
                alignItems: 'center',
                flexDirection: "column"
            }}
        >
            <h1>{name}</h1>
            <div
                style={{
                    width: '80%',
                    height: '90%',
                    backgroundColor: '#acacac',
                }}
            >
                <svg
                    ref={svgRef}
                    style={{
                        width: '100%',
                        height: '100%',
                        border: '1px solid white',
                    }}
                ></svg>
            </div>
        </div>
    );
};
function clicked()에 AAA 주석 부분 수식에서
0.5는, svg size보다 큰 state에서는 비율을 축소해서 보여주고, 작은 state에서는 비율을 확대해서 보여주겠다는 거다.
앞에 8은, 큰 state의 경우 축소해서 보여주는데, 그때 scale에 상한을 걸어두는 숫자이다.